The dreaded scenario came to pass in 2022 for the 60/40 model as both equities and bonds experienced negative returns in the same year for the first time since 19771.
This is in sharp contrast with other periods when the equity component of the 60/40 portfolio suffered – like in the early 2000s or early 1990s, when the loss on equities was at least partially offset by the total return on bonds2. In other words, the 60/40 model has typically helped multi-asset investors ride out difficult markets thanks to the negative return correlation between stocks and bonds.
The catalyst for last year’s negative returns and positive correlation between equity and bond markets was the sharp tightening of monetary policy by central banks to combat persistently high inflation, against a backdrop of low economic growth. That’s because rising rates pull bond prices down and tighter monetary conditions tend to be a headwind for companies’ real earnings, meaning equity prices also fall.
So, with inflation proving sticky, which may necessitate further rate hikes, there’s concern that an environment of higher inflation and positive correlation is here to stay. In particular, investors may be concerned that persistently higher correlations will mean that bonds will provide less diversification going forward and that the concept of a 60/40 portfolio needs to be revisited.
In our 2023 mid-year economic and market outlook, we predict that inflation will come down globally over the next 12 months or so and that the long-term negative return correlation between equities and bonds will reassert itself. But what if it didn’t?
In this article we explore what it would mean for multi-asset investors if equity and bond returns were to remain positively correlated.
How much does correlation matter?
Return correlation between asset classes is an important component of portfolio construction and the lower the correlation, the stronger the diversification benefit. That applies at the level of single securities as well as across asset classes for multi-asset portfolios.
More precisely, correlation provides an estimate of how two variables, in our case returns on equities and bonds, are related. When correlation is negative it means that, on average, bond returns increase when equity returns decrease, and vice versa.
However, the importance of negative correlation for diversification benefits is sometimes overemphasised. The chart below plots two efficient frontiers, illustrating the best possible return for the lowest possible risk for six different mixes of equities and bonds – ranging from 100% bonds to 100% equities. The first frontier – in purple – is constructed using the average correlation between equities and bonds from 2000 to 2021, which was -7%. The 60/40 portfolio here has an expected return of 6.3% and a volatility of 9.4%.
Then, keeping all else equal, we construct the same frontier but this time we assume a much higher and positive return correlation of 33%, which is the average level of correlation between equities and bonds in the 1990s. Even in a positive correlation regime, an investor in a 60/40-style portfolio would only need to shift their allocation marginally to 62% equities to achieve a similar outcome, with an annualised return of 6% and volatility of 10.1%.
Best risk/return frontiers under different global equity/bond correlation regimes
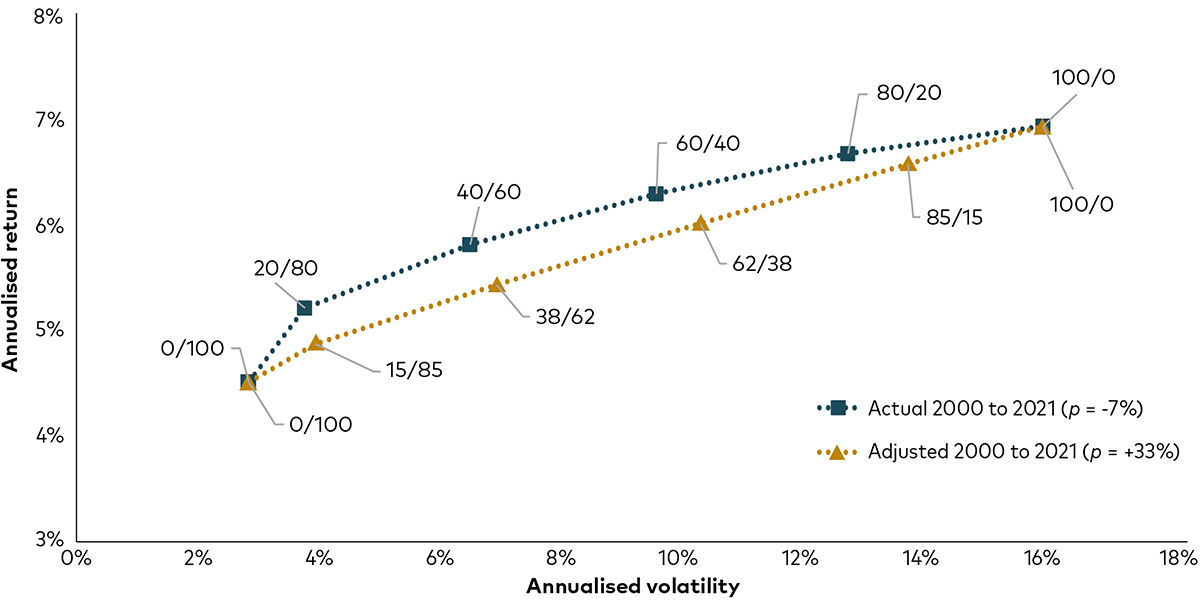
Past performance is not a reliable indicator of future results.
Source: Bloomberg. Notes: Data are monthly total returns in USD from 1 November 2000 to 31 December 2021. Global equities are represented by the MSCI ACWI Index. Global bonds are represented by the Bloomberg Global Aggregate Index Value (USD Hedged). For the period, the observed correlation between equities and bonds was -7%. The correlation coefficient of +33% was estimated using the same indices between 1 January 1990 and 31 December 1999.
While average returns are lower in the positive correlation regime relative to the negative correlation regime, the difference in return outcomes is probably less significant than many investors might expect.
The key message here is that correlation matters – but maybe not as much as most investors would believe. It’s also worth noting that bonds’ diversification properties still work even when fixed income is positively correlated to equities3.
What about inflation-hedging alternatives?
Vanguard economists in the US ran simulations for two portfolios in two different environments, as illustrated in the graphic below. One portfolio consisted of 60% global stocks and 40% global bonds. The other had a 10% allocation to commodities at the expense of the equivalent share of the equity portion and an 8% allocation to intermediate-term treasury inflation-protected securities (TIPS) in the bond portion.
One of the two environments represented our baseline, using Vanguard’s current projections for broad asset class returns, inflation and return correlations over the next 10 years. The other envisioned a future with higher inflation and higher correlations (in many cases, a positive correlation instead of a negative one).
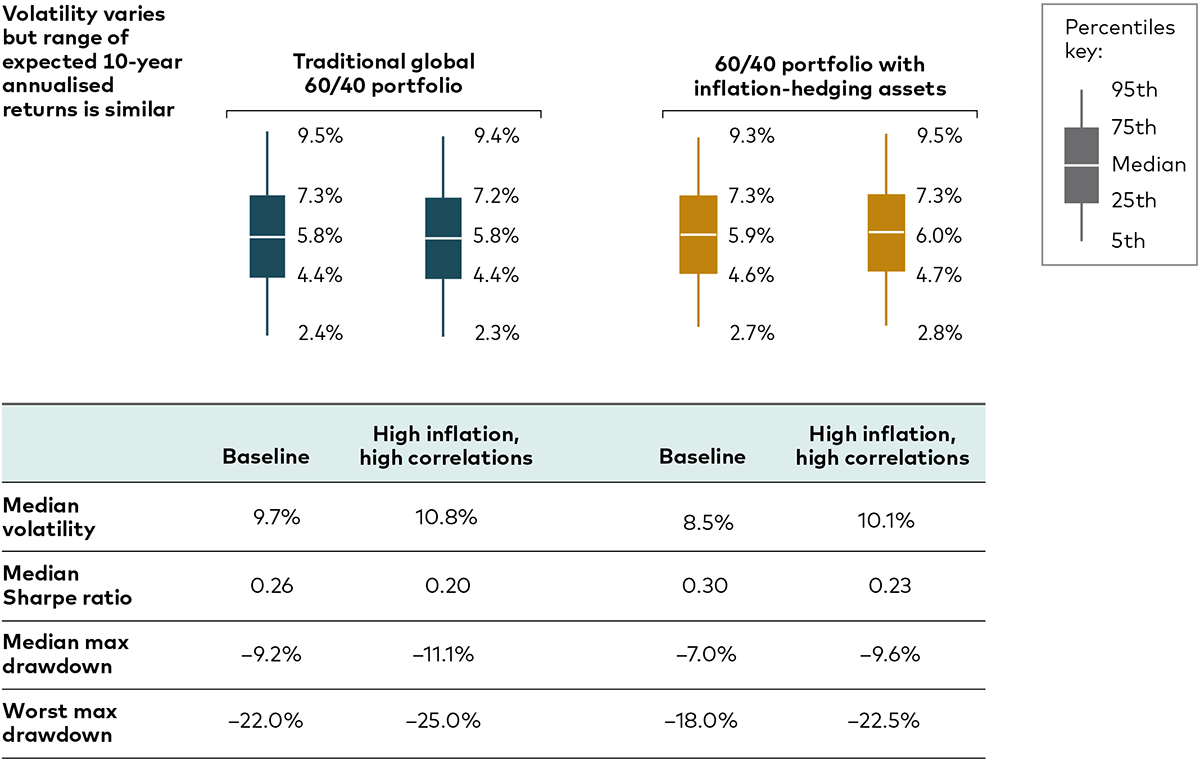
Source: Vanguard, as of 31 May 2023. Notes: The traditional 60/40 portfolio is a mix of 36% US equities, 24% non-US equities, 28% US investment-grade taxable bonds and 12% non-US bonds. The inflation-hedged portfolio is a mix of 30% US equities, 20% non-US equities, 10% commodities, 22% US investment-grade taxable bonds, 8% US TIPS and 10% non-US bonds. The following indices were used as proxies for each asset class: MSCI US Broad Market Index for US equities, MSCI All-Country ex USA Index for non-US equities, Bloomberg US Aggregate Bond Index for US bonds, Bloomberg Global Aggregate ex-USD Index for non-US bonds, Bloomberg US Treasury Inflation-Protected Securities Index for TIPS and Bloomberg Commodity Index for commodities.
IMPORTANT: The projections or other information generated by the Vanguard Capital Markets Model regarding the likelihood of various investment outcomes are hypothetical in nature, do not reflect actual investment results, and are not guarantees of future results. Distribution of return outcomes from the VCMM are derived from 10,000 simulations for each modelled asset class. Simulations are as of 31 May 2023. Results from the model may vary with each use and over time. For more information, please see the Notes section below.
Portfolios in the higher-inflation, higher-correlation scenario had higher volatility and worse potential declines than the baseline scenario. That was true for both the traditional global 60/40 portfolio and the one that included commodities and TIPS. The latter portfolio did have somewhat less volatility than the traditional 60/40 portfolios, alleviating downside risk in particular.
What is remarkable is how similar the range of potential outcomes over 10 years are across both portfolios and both scenarios. It reinforces our view that asset allocation—not inflation or correlation—is the main determinant of long-term returns.
1, 2 Source: Bloomberg. Note: Annual total returns calculated in USD from 1977 to 2022. For equities, we use US equities represented by the MSCI USA Index from 1977 to 1987 and global equities afterwards, represented by the MSCI ACWI Index. For bonds, we use US bonds represented by the Bloomberg U.S. Aggregate Index from 1977 to 1990 and global bonds afterwards, represented by the Bloomberg Global Aggregate Index Value (USD Hedged).
3 Source: Bloomberg. Data between 1 January 1990 to 30 April 2023. Notes: Analysis of global stock and bond returns when global equities have fallen at least 10% from the previous maximum. Global equities are represented by the MSCI ACWI Index. Global bonds are represented by the Bloomberg Global Aggregate Index Value (USD Hedged). Data shows that even during equity downturns when the monthly correlation between equity and bond returns was positive, global bonds tended to provide diversification with positive returns. Returns are calculated in USD.